Analysis Type Descriptions & Libraries
KRIs
KRIs are metrics associated with thresholds (e.g., statistical thresholds such as >=3 standard deviations, set thresholds such as <85% compliance, etc.) that are used to monitor a risk in a particular area, over time. KRIs can be used to monitor and mitigate these risks at the participant, site, country, study, and/or program (cross-study) level. KRI thresholds can be adjusted throughout study if warranted and agreed by the SMT (note, this would require update to the CMP to document the custom threshold).
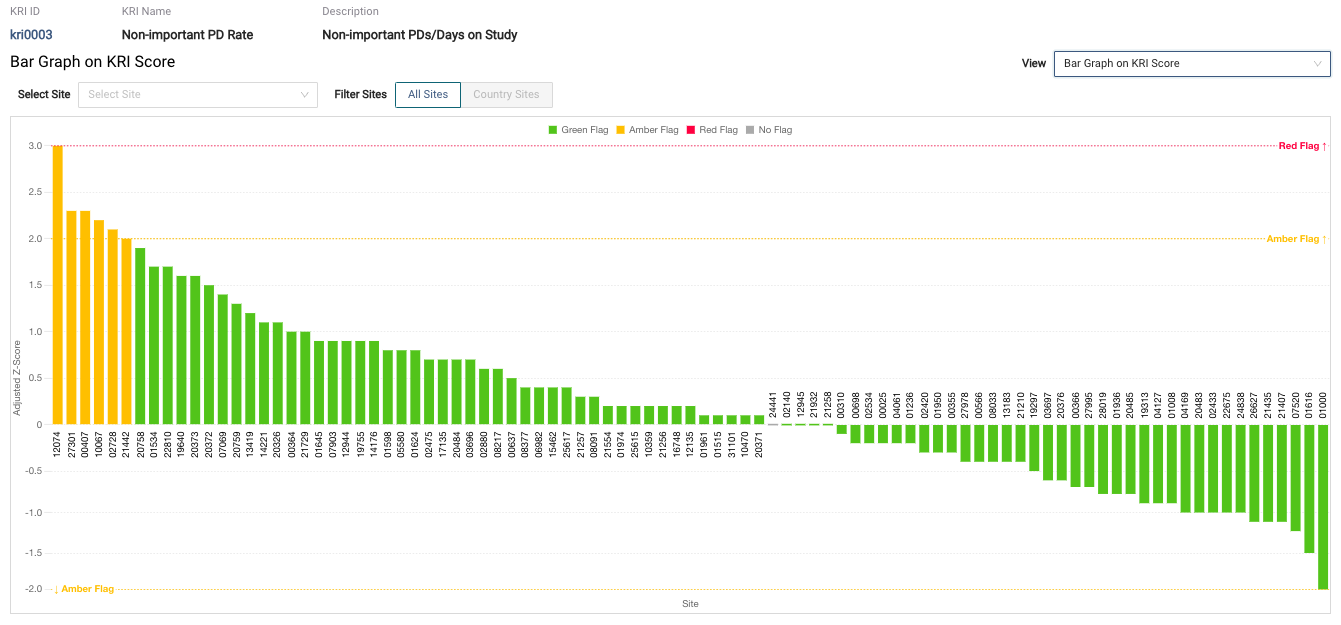
A Query Rate KRI can be used to identify sites with unexpectedly high query rates that may indicate a lack of site understanding of data entry requirements.
When the threshold of interest set for a KRI is crossed, this may (or may not) indicate a risk and warrants review by the Central Monitor and the SMT to confirm if additional actions are needed to mitigate or minimize the risk e.g., by the site facing CRA.
{gsm} KRI Library
The following table details each of the standard KRIs in the {gsm} library.
| KRI | KRI Name | Numerator | Denominator | Population |
|---|---|---|---|---|
| 0001 | AE Reporting Rate | # AEs | Participant days in study | Enrolled |
| 0002 | SAE Reporting Rate | # SAEs | Participant days in study | Enrolled |
| 0003 | Non-Important Protocol Deviation Rate | # Non-Important PDs | Participant days in study | Enrolled |
| 0004 | Important Protocol Deviation Rate | # IPDs | Participant days in study | Enrolled |
| 0005 | G3+ Lab Abnormality Rate | G3+ Abnormal Lab Samples | Total # Lab Samples | Enrolled |
| 0006 | Study Discontinuation Rate | # Subjects Discontinued | Total # Subjects | Enrolled |
| 0007 | Treatment Discontinuation Rate | # Subjects with treatment discontinued | Total # Subjects | Enrolled |
| 0008 | Query Rate | Total # Queries | Total # Data Points | Enrolled |
| 0009 | Delayed Query Resolution Rate | # Queries ever open >30 days | Total # Queries | Enrolled |
| 0010 | Delayed Data Entry Rate | # Forms entered >10 days after visit date | Total # Forms | Enrolled |
| 0011 | Data Change Rate | Fields with 1+ change | Total # Fields | Enrolled |
| 0012 | Screen Failure Rate | # Screen Failed subjects | Total # Screened | Screened |
KRI Risk Thresholds
Because the data collection process in clinical trials is expected to follow the same study protocol, regardless of what participant the data is for or what site it is collected by, we expect the data to be relatively consistent with an appropriate level of variation due to things like random error. It is when data becomes “too” different (or too consistent, aka “too good to be true”) that attention should be paid to assess if there may be an unacceptable reason for this difference.
Since some variation is expected, KRIs leverage thresholds to help determine when the data or metric for a participant, site, country, etc. has become potentially concerning. Further, more than one level of threshold can be used to assess “how risky” the particular metric’s value is. For example, <5% (color coded amber) may be used to indicate an early signal of risk, while <0.3% (color coded red) may be used to indicate the highest level of risk.
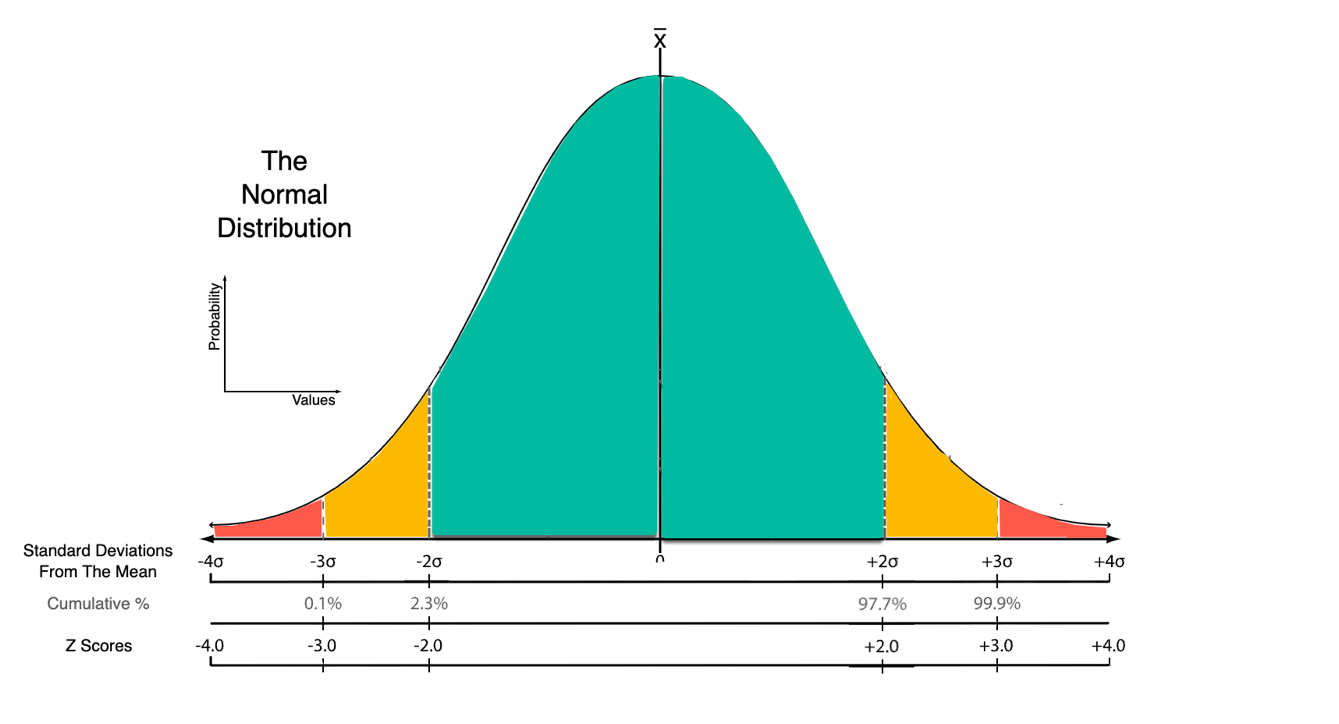
These thresholds are set using statistical methods (which vary by analysis). The variation in the data is assumed to follow a “normal distribution” where the values are distributed in a bell shape. The bell curve is divided into sections representing standard deviations (see example below). A z-score then describes how many standard deviations a data point (or metric like “% of subjects that discontinue study drug”) is from the mean, and is estimated using the overall study data. If the value is very far from the mean, it would be considered unlikely based on expected variability due to random error (and thus potentially an issue, aka a signal of risk). KRI thresholds are selected based on >2 and >3 standard deviation z-scores as shown in the table below and correspond to probabilities of observing such events <5% and <0.3%, respectively.
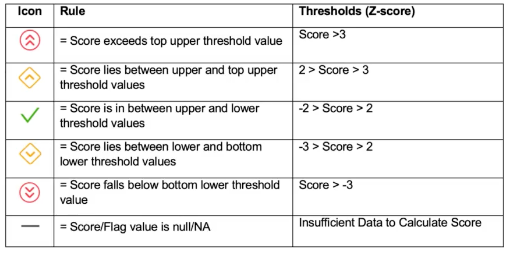
KRIs use green, amber, and red flags to indicate if the value of the KRI is low, moderate, or high risk.
CSM
CSM analyses are more sophisticated analyses, which use statistical methods to detect data risk. Like KRIs, CSM can be used to monitor risk at the participant, site, country, study, and/or program level.
We can use statistical methods to analyze the data reported by sites to identify those sites that are reporting data that is “too good to be true” (i.e., risk of misconduct) via an Inlier Analysis.
When a participant, site, country, etc. are identified as outliers by a CSM analysis (i.e., are reporting data very differently compared to that reported for other participants, sites, countries, etc.) this also indicates elevated risk of non-random variability (e.g., bias introduced in the data via intentional or unintentional misconduct) and warrants review to confirm if additional actions are needed to mitigate or minimize the risk.
Currently CSM analyses are under development. The following are examples of potential CSM analyses that may be developed.
| Analysis | Description |
|---|---|
| Duplicate Participants | Potentially duplicate subjects flagged based on date of birth |
| Multivariate Inliers | Identify data that is “too good to be true” indicating potential fabrication |
| Digit Preference | Identify trends in data values reported with same/similar digits; may indicate data fabrication |
| Duplicated Records | Identify potentially duplicated data which may indicate transcription error or data fabrication |
| Tests and Visit Distribution | Identify unusual changes/patterns in critical assessments across visits; may indicate quality issues |
QTLs
Unlike KRIs and CSM, QTLs (or acceptable ranges) are focused on study level risk. Specifically, QTLs are intended to monitor for systematic risks that could ultimately impact participants’ safety or the reliability of study results. The limits, or thresholds, are expected to be set by a cross-functional group including both statistical and clinical experts. Thresholds are based on historic knowledge (i.e. prior similar studies, literature/publications, etc.), should be pre-determined (i.e., prior to first patient first visit) and generally should not be adjusted throughout study without strong justification. A major difference between QTLs and KRIs/CSM is the results of QTL monitoring are submitted for possible inclusion in the final Clinical Study Report (CSR) to show evidence of risk monitoring.
A QTL parameter may be the “proportion of randomized subjects that prematurely discontinue study drug.” This is obviously critical in that if too many subjects do not have adequate exposure to study drug, the reliability of their endpoint data may come into question.
When a QTL parameter exceeds the tolerance limit (i.e., threshold) set, the QTL deviation triggers cross-functional investigation into the root cause. Based on the outcome of that root cause investigation, mitigating actions may be implemented. The ultimate goal would be to bring the QTL parameter value back below the tolerance limit before study end, if possible.
The following QTL parameters are available in {gsm}, to be applied when applicable. In future, additional parameters may be developed.
| Parameter | Description |
|---|---|
| Inclusion/Exclusion | Proportion of randomized subjects with any inclusion or exclusion criteria deviations. |
| Premature Study Discontinuation | Proportion of randomized and dosed subjects that discontinue study prior to the expected timepoint. |
KRI Visualizations
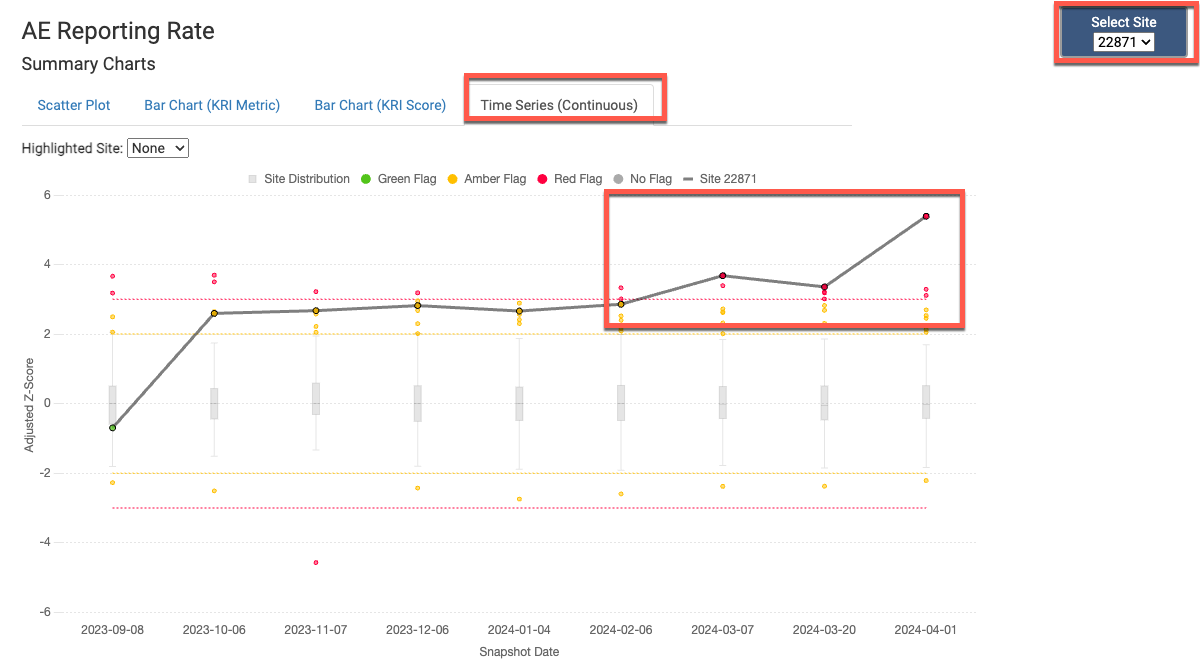
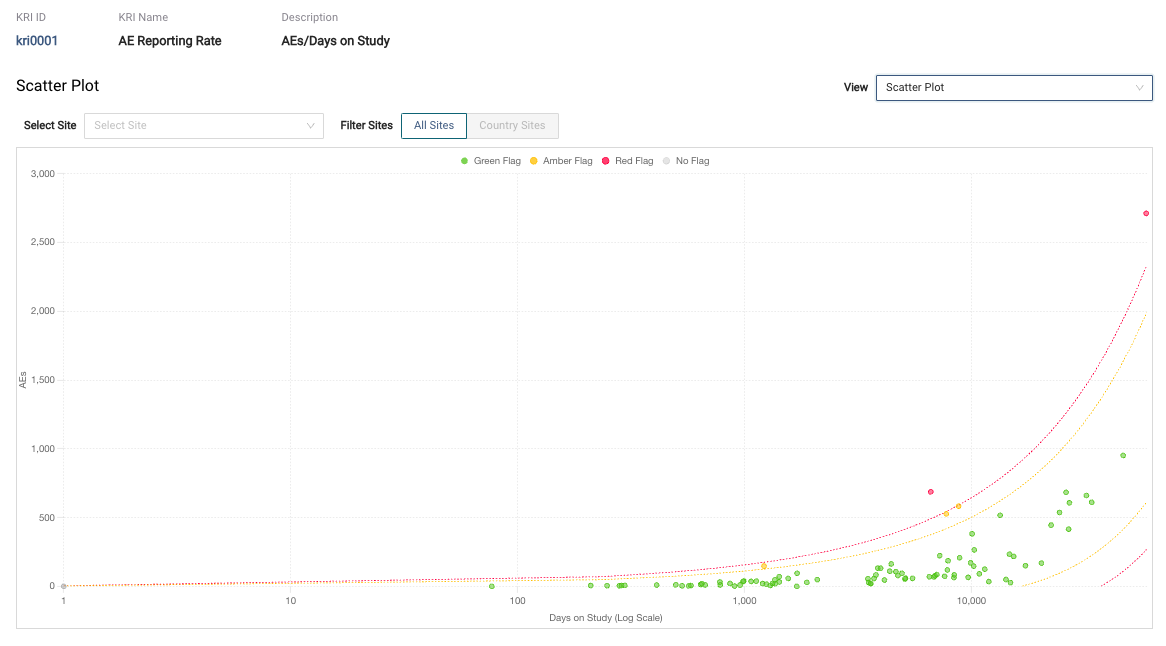
There are a variety of visualizations that support the identification of participants, sites, and countries of interest. These visualizations are surfaced in {gsm} visualizations and are included in KRI reports. For example:
Scatter Plots
Bar Graphs
Trends over time