Query Rate
This KRI flags sites and countries with unexpectedly high query rates which are calculated as the total number of queries for the site/country (manual and edit checks) relative to the total number of data points for the site/country. It does not indicate or take into consideration whether those queries have been resolved or closed.
Steps to Perform the Review
-
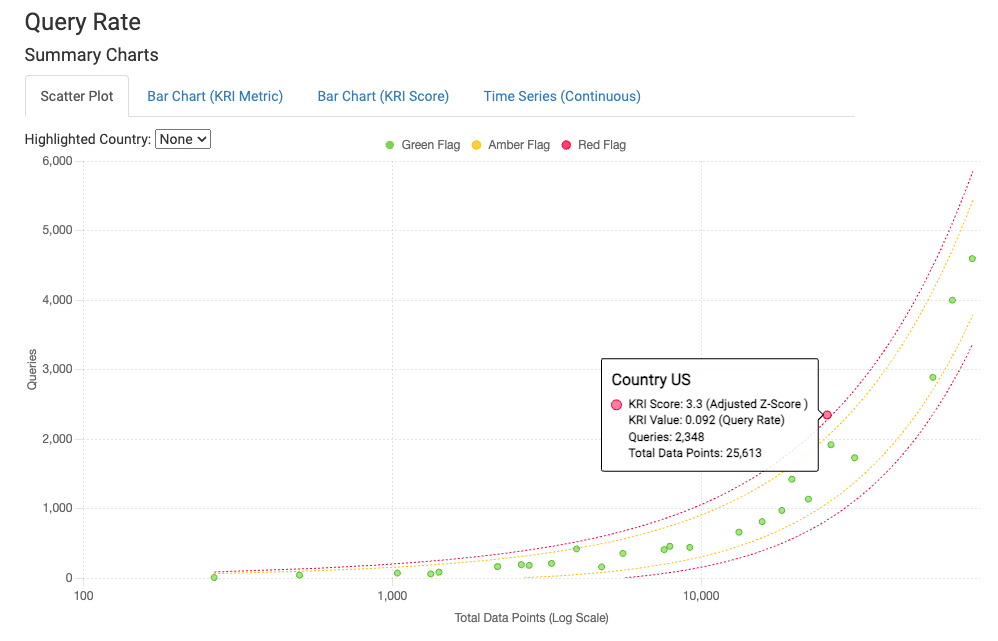
In the KRI Report by Country, review the Query Rate KRI scatter plot for countries in red.
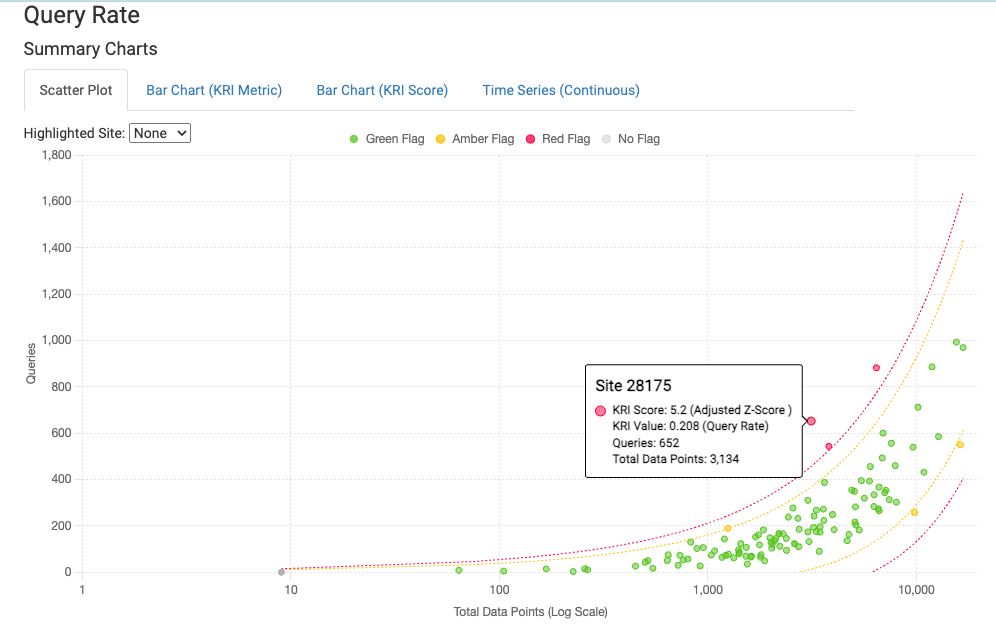
Here the country shown is an outlier with 9% query rate. However, when reviewing the sites contributing to this trend, there is only 1 site that is an outlier in query reporting. Thus, this appears to be a country trend but is truly a site trend.
-
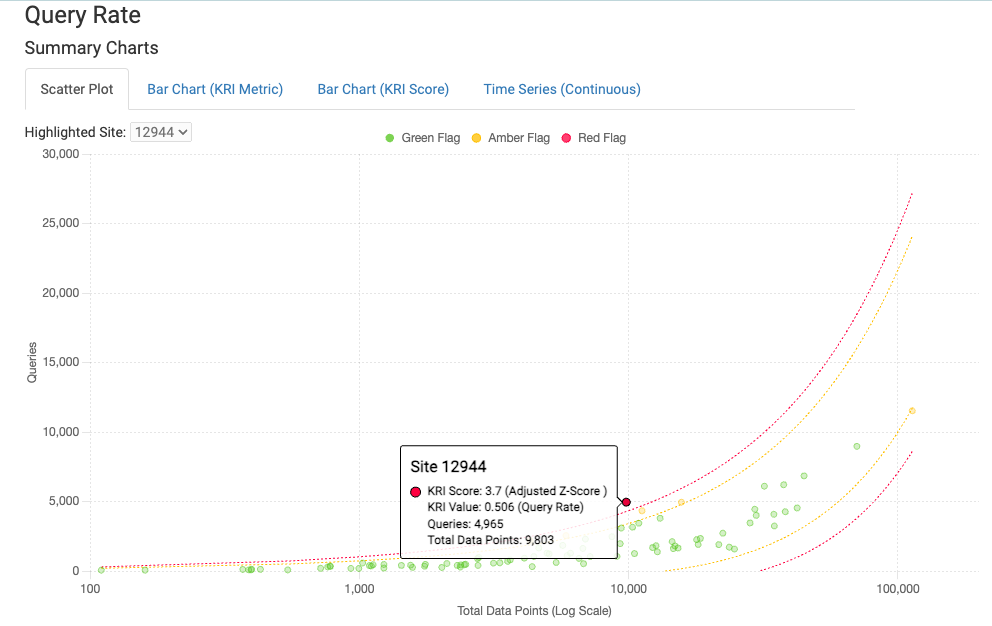
In the KRI Report by Site, review the Query Rate KRI scatter plot for sites in red.
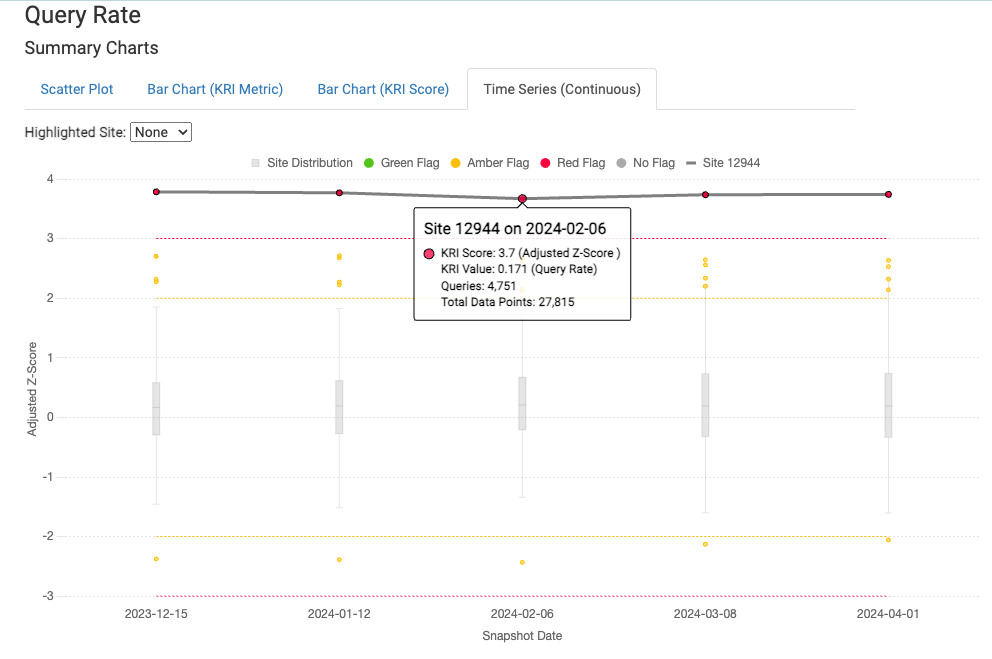
Site 12944 is an outlier with a 50.6% query rate. This means for every 2 data points, 1 was queried, indicating a high potential for site misunderstanding of data entry requirements. Looking at the time series trending, the site’s query rate has gone from 17% to 50% over the course of several months.
-
Briefly review queries issued to the site to assess if there are any particular areas of concern e.g., high % of edit checks vs manual queries, particular forms with high % of queries, etc. These trends can help inform and target a CRA’s follow-up investigation with the site.