AE Reporting Rate
AE Rate: the AE KRI flags sites and countries with unexpectedly high or low AE rates which are calculated as the total number of AEs for the site/country relative to (normalized by) the cumulative number of days participants have been on study for the site/country.
Steps to Perform the Review
-
Review the AE Reporting Rate scatter plot for outlier countries. For example, here the highlighted country is an outlier with an unexpectedly high AE rate. The plot provides a visual to assess how extreme the outlier is (i.e., the higher above or below the red line the country is, the more extreme the rate and higher the likelihood is of the signal representing an underlying issue).
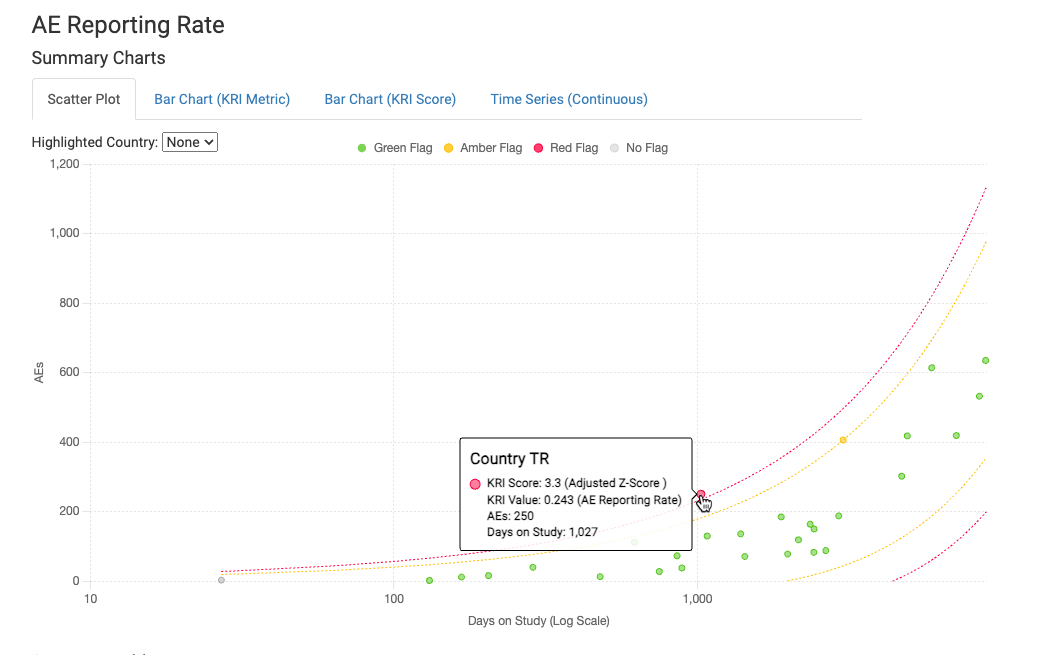
Before confirming action is required at the country level, assess if the signal is truly country level or if a particular site(s) is resulting in the country level signal. See site level investigation steps below.
-
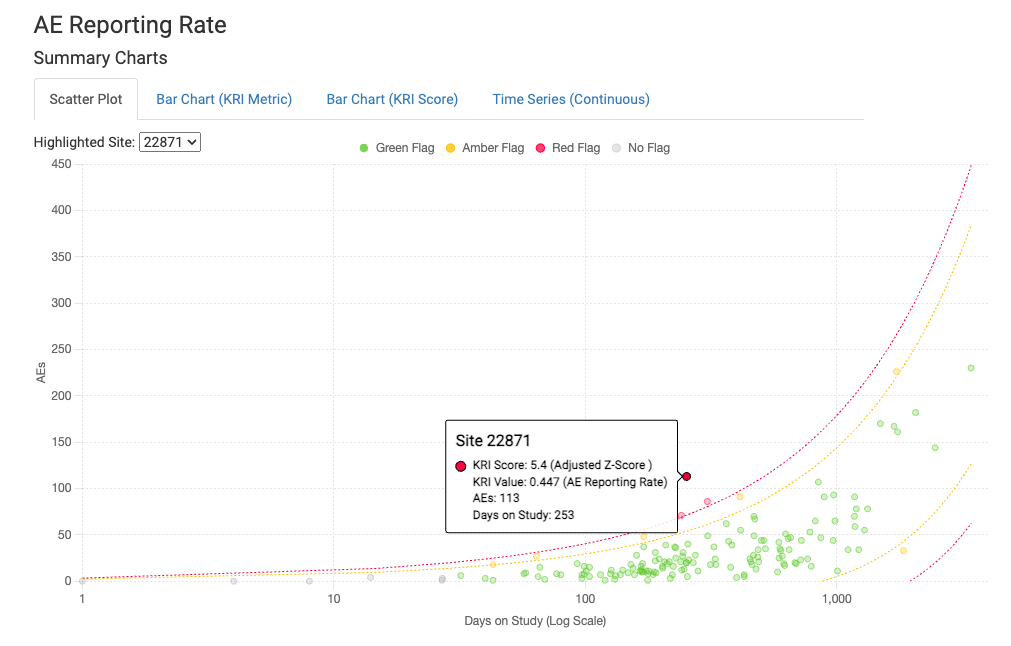
For site level outliers, review the AE Reporting Rate scatter plot for outlier sites. For example, site 22871 in the screenshot below is an outlier with an unexpectedly high AE rate.
Investigate Signals
-
Perform an initial investigation into the signal, based on the data available and supporting visualization. This should include reviewing:
a. How many sites are contributing to this signal if it is a country outlier? If it is just 1 or a small proportion e.g., 2 out of 7, this is more likely a site trend vs a country trend and so should not be escalated at the country level.
b. How many subjects are contributing to the signal? If it is a large proportion of the overall number of enrolled subjects for the study, this could have a bigger impact on the data quality than if it was a very small proportion (remember, even if the participants are no longer on study, there is still a risk that AEs are reported in the source that were not transcribed to EDC).
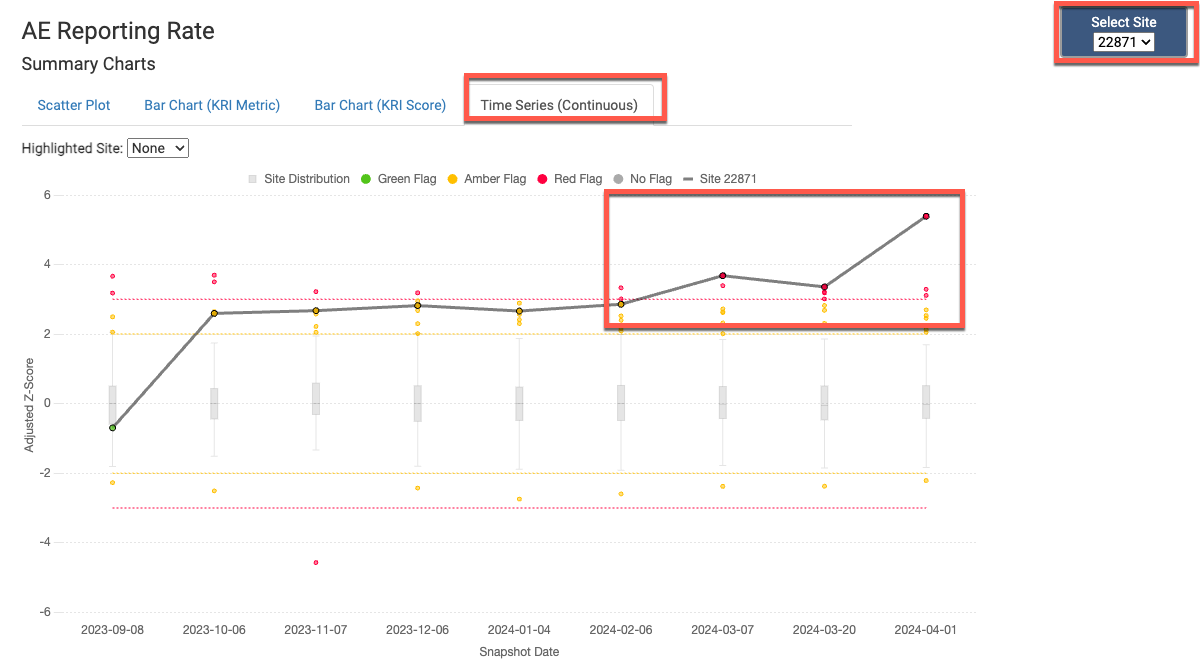
c. Review for worsening trends using the Time Series tab in the KRI report. For example, here outlier site 22871 has worsened over the last several months, which indicates an increase in the risk and is worth adding to the signal description.
For High Outliers
Briefly review the AEs reported via the deep dive app to assess if the high rate may be due to:
- Sites reporting symptoms separately vs underlying conditions (i.e., related symptoms like cough, fever, sore throat with same or overlapping start dates). If the eCRF Guidelines instruct sites to report only conditions, not underlying symptoms, this may require site retraining and data updates.
- Sicker patients may be enrolled e.g., if there are multiple SAEs and AEs appear to be reported appropriately, it may warrant the Medical Monitor reviewing the subjects to ensure they were appropriately enrolled.
- Are there meaningful differences between the study and site in proportion of AEs that are Ongoing, Serious, particular Grade, or related to study drug?
- Does the site have a much higher proportion of AEs in a particular SOC that could indicate a specific area of under-reporting? For example, a site has a much higher proportion of AEs reported in the Investigation SOC (e.g., lab values) than the study rate (34% vs 16%).
- Brief review of the AE data can confirm this and provide examples of potential over-reporting.
For Low Outliers
Briefly review:
- How many subjects are contributing to the low rate (i.e. that have a low subject AE rate or 0 AEs reported). If only 1 or small proportion of subjects at the site or country, make note in the Signal Description as this will be important information to support targeted follow-up action.
- Are there meaningful differences between the study and site in proportion of AEs that are ongoing, Serious, particular Grade, ongoing, or related to study drug that could indicate an area of under-reporting? Does the site have a much smaller proportion of AEs in a particular SOC that could indicate a specific area of under-reporting e.g., study has a high rate of infection-related events but the site has 0 despite having multiple participants on study for a long duration.
- If the site has active participants, how long has it been since the site entered AEs? For example, a site that is a low outlier and has a much higher % of AEs ongoing than across study (site is potentially not updating AEs) and has not reported any AEs for 6 months. Together these support the potential issue of under-reporting/site process gap.
- How long have the subjects in the site or country of interest been on study? If early in study, it may be too early to be able to say with confidence that the signal warrants additional investigation. If subjects (on average) have been on study for a longer duration and AEs would have been expected (based on how sick the patients are on study) this would warrant escalation.